1611 Forecasting
Election Day November 3, 2026
Loading every House district.
Senate and governor counts are races on the 2026 ballot, not the full chamber. House is every seat. 218 is a House majority. Every figure on this page is a prediction. None of it is an official result or a count of ballots cast.
Latest
Checking polls
Polls
Waiting for the poll table.
Minnesota
The margin is the sum of the counties or district pieces.
 DFLAmy Klobuchar, DFLAmy Klobuchar · Open seatSenateD+11.0
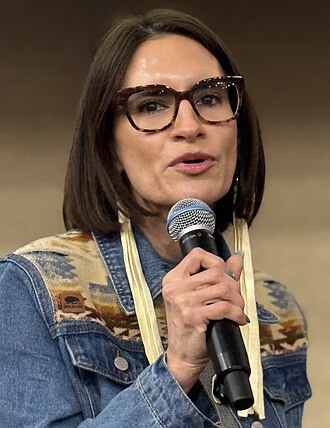 DFLPeggy Flanagan, DFLPeggy Flanagan · Open seat
Loading Minnesota.
Closest Senate races
Minnesota is open above. These are the other races on this map.
 DTroy Jackson, DMaine · SenateTroy Jacksonvs Susan CollinsD+0.755.9% to win
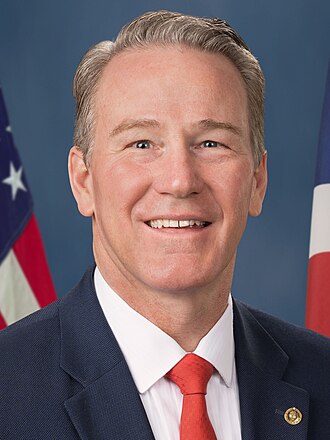 RJon Husted, ROhio · Senate specialJon Hustedvs Sherrod BrownR+0.756.1% to win
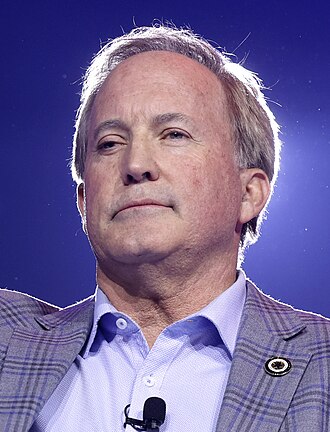 RKen Paxton, RTexas · Senate · OpenKen Paxtonvs James TalaricoR+1.056.8% to win
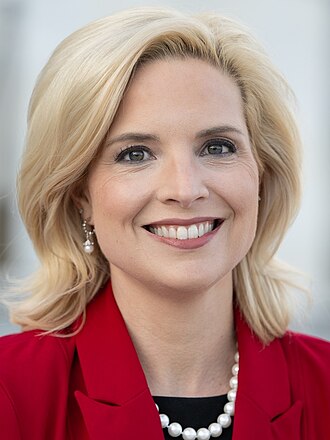 RAshley Hinson, RIowa · Senate · OpenAshley Hinsonvs Josh TurekR+1.663.2% to win
 RRoger Marshall, RKansas · SenateRoger Marshallvs Adam HamiltonR+3.871.4% to win
 DAbdul El-Sayed, DMichigan · Senate · OpenAbdul El-Sayedvs Mike RogersD+3.979.9% to win
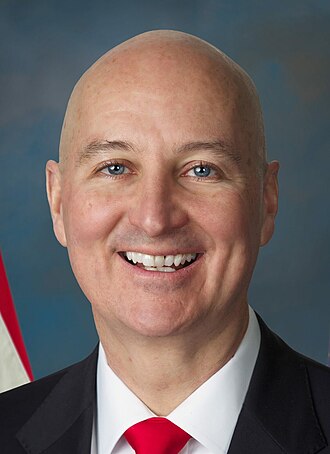 RPete Ricketts, RNebraska · SenatePete Rickettsvs Dan OsbornR+5.275.0% to win
 DRoy Cooper, DNorth Carolina · Senate · OpenRoy Coopervs Michael WhatleyD+5.579.6% to win
 DJon Ossoff, DGeorgia · SenateJon Ossoffvs Mike CollinsD+5.783.2% to win
 RDan S. Sullivan, RAlaska · SenateDan S. Sullivanvs Mary PeltolaR+6.583.3% to win
All states
Methodology
The published result is the sum of the counties, or of the pieces of counties inside a district. A poll average is an input. It is not the result.
What is being forecast
Every 2026 governor, Senate, and U.S. House race. The forecast is dated November 1, 2026. Election Day is November 3, 2026. Each race is the general-election pair. A primary market, a primary poll, and a candidate who is not on the general-election ballot are not inputs.
National environment
The generic congressional ballot, October 30, 2026, is Democrats 51.7, Republicans 43.1, other 5.2. Wikipedia generic-ballot aggregate of Decision Desk HQ, FiftyPlusOne, NBC News, RealClearPolitics, and Silver Bulletin, 2026-10-30: Republicans 43.1, Democrats 51.7, other or undecided 5.2. Input to the national block (60%), not the county-sum result. A later RealClearPolitics page alone is not substituted for that average. Party identification is Pew at 55 percent and Gallup at 45 percent. Pew’s 2026 figure is Republican 43, Democratic 48. Gallup’s first half of 2026 is Republican 39, Democratic 49. The national block is 60 percent generic ballot and 40 percent party identification.
Only the share of the swing this state has actually taken is transmitted. Elasticity is the state’s 2022 move relative to its 2020 presidential margin, divided by the same national move, then shrunk halfway toward 1. A race that has its own poll shrinks from the 60/40 national block. A race without its own poll uses the generic-ballot swing, which is the generic ballot minus the 2024 presidential margin. In a state with a public generic-ballot poll, that local swing is 65 percent and the generic-ballot swing is 35 percent. No state is given another state’s number. The race page prints the swing that was actually used. On top of that, each state gets a small environment of its own, capped at 1.5 points. Where a state ballot exists, 20 percent of the gap between that ballot and the generic-ballot swing is kept. Otherwise 15 percent of the gap between that state’s 2022 governor or Senate margin and the national midterm shift is kept. Florida, Iowa, Wisconsin, and Arizona already have their own adjustment and are not given a second one. House uses the full swing as its one statewide-environment weight. The House page also shows a state-environment line. That line is the same number. It is not a second weight, and it is not 45 percent of the swing.
History
Senate and governor history uses 2018, 2020, 2022, and 2024 for that office. Nothing earlier. If the office was on the ballot in 2022, the weights are 40 percent 2022, 35 percent 2024, 20 percent 2020, and 5 percent 2018. If it was not, 2022’s weight falls back to 2018: 40 percent 2018, 35 percent 2024, 20 percent 2020, and 5 percent 2022. A missing year is filled with the 2020 result for the same office. Another office is not used. If that year had no Democrat or no Republican, the result is not scored as Republican minus zero. The missing party’s votes sat on the winner, so that margin is not a partisan one. The presidential margin for that year is used instead. An independent who was the real opponent, and who beat the major party on the ballot, is still scored as the opponent. If no incumbent is on a governor ballot, the 2022 result keeps 40 percent of its usual weight and 40 percent of its gap versus that state’s 2024 presidential margin. The prior nominee’s margin is not the open-seat baseline.
A 2024 county map is not copied forward. Each county starts at the last comparable result and is moved by the midterm electorate and the polls. The county’s presidential lean places a statewide result inside the county. Rural and presidential-only counties move farther than the metros. The counties are then added up. That sum is the result. A precinct view, where the file exists, spreads that county’s forecast across the 2024 presidential precincts. The precincts add back up to the county. They are not a separate model.
Senate
Weights before a prediction market. They sum to 100.
| Polling | 22.5 |
| State partisan lean | 15.3 |
| Presidential popularity | 10.2 |
| Generic ballot | 9.5 |
| Candidate favorability | 9.4 |
| History | 6.8 |
| Candidate | 5.1 |
| National environment | 5.1 |
| Electorate | 4.2 |
| State environment | 3.4 |
| Turnout | 2.5 |
| Demographics | 2.5 |
| Finance | 1.7 |
| Issues | 1.8 |
Partisan lean is the state’s 2024 presidential margin. It is not shrunk toward the polling term. The candidate weight in the table is a slice of the office baseline. It is not the incumbent points. Those points are added whole, after the blend. On a race with at least three public polls from different pollsters that are not outliers, the points may move toward that poll but may not push the result further past it. An outlier is already cut in half. It does not erase the other polls.
An uncontroversial incumbent in a state that keeps incumbents receives 1.5 points. A state that has not kept its last two incumbents receives less. An appointed incumbent who has not won the seat receives half. A scandal-defined candidate loses that bonus. A first or second term, under eight years in the office, is unchanged. Longer service adds 0.4 points from eight years, 0.8 from twelve, and 1.2 from eighteen. It is capped there. It is not added again as favorability. A scandal is a documented controversy that is a subject of the race: a formal ethics inquiry, a pending criminal case, or a record that the campaign itself is about. A routine attack is not one. A closed case ended by a pardon is not one. Personal misconduct under a formal inquiry also takes points off that candidate. An old record that is the subject of the campaign takes less. A same-party race does not get an extra partisan swing.
Governor
The same structure, with a larger candidate term and a larger state environment.
| Polling | 22.5 |
| State partisan lean | 13.6 |
| Presidential popularity | 10.2 |
| Generic ballot | 9.5 |
| Candidate favorability | 9.4 |
| History | 6.9 |
| Candidate | 6.8 |
| Electorate | 4.2 |
| State environment | 4.2 |
| National environment | 4.2 |
| Turnout | 2.5 |
| Demographics | 2.5 |
| Finance | 1.7 |
| Issues | 1.8 |
An elected governor receives 3 points, added whole. A sourced job-approval net of +10 or better raises that to 4.5. A net of +20 or better raises it to 6. Underwater approval stays at 1.5. No sourced rating stays at 3. An appointed governor who has not won the office receives half. The same thick-poll rule applies: three agreeing public polls are not pushed further past themselves. The approval figures are Morning Consult, April 2026, except where a later state poll is the sourced rating. Finance and issues have no separate score, so those weights sit on history.
House
House is not a smaller version of the Senate model. A statewide Senate or governor poll is not a district poll. With no public likely-voter poll of the district, the race is fundamentals only and the interval is wider. One partisan internal is not a polling term.
| District baseline | 22.0 |
| Generic ballot | 14.8 |
| District polling | 14.0 |
| Incumbent overperformance | 12.6 |
| Statewide environment | 9.4 |
| Candidate quality | 6.3 |
| District partisan lean | 6.5 |
| Presidential popularity | 6.5 |
| Favorability | 4.8 |
| Fundraising | 3.1 |
The baseline is the 2024 presidential vote inside the current district lines. Where a county is split, the pieces are weighted by the votes cast in each district, not equally.
Cook PVI is applied to every House district. It is a share index, not a margin. A score of R+10 means that district ran 10 share points more Republican than the nation. The margin is the national 2024 presidential margin plus twice the PVI, so R+10 and a national margin of R+1.5 is a district margin of about R+21.5, not R+11.5. The same conversion is used for a Democratic score. If the whole-county average and that converted margin disagree by more than 3 points, only the split pieces are moved toward the converted PVI. A county entirely inside the district keeps its own 2024 presidential margin. The move on a split piece is capped at 20 points when those pieces are under half the district, and at 40 when they are half or more. If every county is split, the pieces take the full difference. County signs are not flipped as their own step.
The 2024 House result is used when it was on these lines. If that winner is on the ballot, the baseline is the full 2024 margin. An open seat does not keep any of that margin. The baseline is the presidential vote, and the generic ballot moves it from there. A state on new 2026 lines does not copy the old margin into the baseline. If that winner is still on the ballot, the personal margin is the 2024 House result minus the 2024 presidential vote on the lines they actually ran on. That whole margin is added. It is not cut in half, and it is not faded because the new district voted the other way.
When the 2024 margin is already the baseline, favorability is zero and the overperformance weight sits on that same baseline. It is not a second bonus. A primary opponent is not the general-election baseline. A result may not move more than halfway from the district’s last presidential margin to a thin poll or to the statewide environment. A seat the same party carried by 10 or more stays on that side of the floor. A presidential index does not erase a House win on these lines: if that winner is on the ballot and the 2024 result went the other way from the PVI, the PVI does not flip the seat. On a new map the old personal win is not a candidate-quality bump except for that personal margin. Long service is still added whole: 0.4 points from eight years, 0.8 from twelve, and 1.2 from eighteen. College, rural, and nonwhite shares are not used in a House score.
Polls
Public likely-voter polls are the polling term. Two days from Election Day that term, and the generic ballot next to it, take a larger share than they did earlier in the fall. The filters did not change. A registered-voter poll is counted at 90 percent. Recency has a 16-day half-life. A sample of size n is weighted n divided by n plus 350. An internal poll, or a poll sponsored by one party, is not used. If the file is internals only, those polls are dropped and the race is rated from the baseline and the generic ballot. A race with no public poll already uses the generic ballot as its environment, so that weight is not added a second time. A poll more than 8 points from the median of the others is cut in half. A pollster grade nudges that weight by only a few percent. House polls use the same nudge. The grade does not decide the race.
Named support does not move. A Libertarian, Green, Constitution, or other minor-party candidate is not listed. Those votes are in Other. Democrat and Republican totals are unchanged. An independent who is a main opponent stays named. Only an undecided line is split, and only once. If a poll has no undecided line, it is left alone. The split is that state or district’s 2024 two-party share, moved halfway to 50 and capped at 60/40. A place at 57 percent Republican sends the undecided 53.5 / 46.5 Republican. This is not run on the county layer and not run in the history block. When a named independent is ahead of a major-party nominee in the ballot tests, that share is reserved and taken from the party they outpoll. The published margin is then the leader’s lead over second place, not a two-party margin with the independent folded into the other major party.
With a poll, the history blocks move toward it. The move is 35 percent in the ordinary case, 20 percent when the state missed in the same direction in both of the last two sourced cycles, and 60 percent when the office history and the presidential lean differ by more than 12 points. The past miss itself is added only to the polling term. The newer cycle is 70 percent of that miss and the older cycle is 30. If they point the same way, 60 percent of the blend is kept. If they point opposite ways, 35 percent is kept. One cycle keeps 40 percent. The adjustment is capped at 2.5 points. A district poll does not inherit a statewide miss. Partisan lean, presidential popularity, and favorability are not shrunk. If the state’s 2024 presidential margin was more than 10 points, a thin poll may not move a Senate or governor result more than halfway from the office baseline to the poll. One poll does not rewrite the state. Three public polls from different pollsters that are not outliers lift that floor. An outlier is already cut in half. It does not turn the rest of the file into one poll.
Presidential popularity and favorability
Presidential approval is the New York Times average of October 29, 2026: 37.4 percent approve, 60.2 percent disapprove. Four-tenths of that net is a margin, then scaled by the place’s partisan lean, so an unpopular president costs more in a Democratic state and less in a state that voted for the president by a wide margin. It is its own term. It is not folded into the generic ballot.
Favorability is the incumbent’s own last race for this office, minus that year’s presidential margin. Thirty-five percent of that gap is kept, capped at 5 points. If that race is already in the history block, or the House baseline is already that member’s margin, the term is zero. Another candidate’s margin is not this incumbent’s favorability. An open seat is zero. There is no separate favorability poll.
Prediction markets
A qualifying market is 5 percent of every governor, Senate, and House score. The other weights are scaled by 0.95 so the total stays 100. The 5 points are not taken out of polling alone. The price is the mid on Polymarket and Kalshi. If both exist, they are averaged. A book under $10,000 is ignored. A market that names a different pair, and every primary market, is ignored.
The price is a win probability, not a vote share. A price of 50 is a tie. Each point above 50 is 0.35 margin points, capped at 12, so 65 becomes about 5 and 90 becomes 12. That margin is then shrunk 40 percent toward the model’s pre-market margin. The market enters once. It does not also nudge the polling term. If the market and the polls disagree by more than 15 points of win probability, the market weight is cut in half and the interval is wider.
Other ratings
Cook, Sabato’s Crystal Ball, Inside Elections, and the other ratings printed on those same tables are a small last step. The other columns are Decision Desk HQ, RealClearPolitics, Split Ticket, FiftyPlusOne, The Economist, Fox News, and Silver Bulletin. A race with three or more ratings gives that average 3 percent. Fewer than three gives it 2 percent. If the board spans more than 8 points, the weight is cut in half. A toss-up is 0. Tilt is 1.5, lean is 3.5, likely is 7, and safe or solid is 12, signed to that party. If the model is already further to that side than the rating, the rating does not pull it back. A safe rating is not treated as a 12-point forecast of a landslide. The average is mixed in after the market, the state adjustment, and early vote. It does not replace a poll, and it is not taken out of the polling weight. A House seat that none of them has rated is left alone. ElectIndex does not publish a table that can be read without guessing, so it is not in the average.
Turnout and early vote
Turnout is built from counties. Mail, in-person early, and Election Day shares come from the last comparable election, not from 2020 when that year was a mail spike. A county is weighted by its share of the state vote, its partisan lean, and its usual turnout. Small counties shrink toward the state mix. When the finished margin is spread back to counties, a smaller county moves farther than a large one. That spread is ballot size. It is not the demographic file.
College, nonwhite, and rural shares enter only the Senate and governor demographics block: the 2012–2016 American Community Survey five-year estimates for college and nonwhite, and the 2010 Census for rural, from the 2018 county election-context file. They are not a 2026 survey. Alaska is missing from that file.
Verified 2026 early vote is a check, not the result. What counts is returned mail plus in-person ballots, and only where those add to the reported number of ballots cast. Applications and ballots that were only sent are not counted. A day-one pace is not the early-vote period. A board report with no numbers does not move a race.
Where the state prints a party on the ballots already cast, that party split is compared with the same point in 2022. Fifteen percent of the change is kept, and the adjustment is capped at one point. The raw Democratic lead in the mail is not the adjustment. Where there is no same-day 2022 comparison, the counties the ballots came from are used instead. The points go on Senate and governor races only. They are not applied to a House district.
Where the file has ballots but no party, or party with no 2022 comparison, each county’s ballots are given that county’s 2024 presidential margin. The mix of counties that have voted is compared with the 2024 vote in those same counties. That is the demographic geography of the early vote. Fifteen percent of the difference is kept, capped at one point, on Senate and governor races only. A county file that does not cover the state, or whose names do not match the presidential counties, is not used. This is where the ballots were cast. It is not a count of how anyone voted.
Where the state prints race or age on the ballots themselves, that mix is read next to the party or county comparison. It does not add a second point. College, nonwhite, and rural shares still scale how far the national swing moves a county. Those shares are not replaced by the early-vote file.
Texas does not put a party on the ballot. The adjustment is primary history, people who have voted in a primary, compared with the same point in 2022. Fifteen percent of that change is kept, capped at one point, on the Senate and governor races only. Day 9 is already past that cap, on the Democratic side. A day-10 statewide count is still past the cap in the same direction, so it is not added again. Justin Vos’s day-10 county posts are that same primary-history count. The counties he published are more than half the ballots and more Democratic than the state, so they are not the statewide margin. They point the same way. His October 26 TargetSmart chart is not used. The counties the ballots came from are not added on top. A model that assigns a party to someone with no primary record is not used.
Ohio’s October 6 and 7 county early-in-person file is separate. Ten percent of how far the party split moved from the first day to the second is kept, capped at one point, and applied to every Ohio race. That file and the county mix do not stack past one point. VoteHub’s modeled electorate is not entered.
Sources
These are the files the forecast is built from. A source is an input. It is not the result, and none of these files is an official 2026 return.
| Past results | Governor, Senate, and House general-election candidate returns, 2006 through 2024. County presidential returns for 2020 and 2024. County canvasses for the 2018 Senate, the 2018 governor race, the 2018 House, and the 2022 governor race. |
| Polls | Wikipedia’s poll table for each 2026 Senate and governor race, and a district poll only when one is published for that House seat. Read October 29, 2026. The average row is one input. The individual polls are another. Wedgewood, the DCCC, St. Pete Polls, and Change Research are not used. |
| Generic ballot | Wikipedia’s aggregate of Decision Desk HQ, FiftyPlusOne, NBC News, RealClearPolitics, and Silver Bulletin, October 27, 2026. |
| State ballots | Marist in Maine, Michigan, New York, and Ohio. Saint Anselm College and AARP in New Hampshire. |
| Party identification | Pew’s 2026 NPORS. Gallup’s first half of 2026. |
| Presidential approval | New York Times approval average, October 29, 2026. |
| Governor approval | Morning Consult, April 2026. Connecticut is Sacred Heart and GreatBlue, September 2026. |
| House index and ratings | The 2026 House tables on Wikipedia, including Cook PVI. The rating columns are Cook, Sabato’s Crystal Ball, Inside Elections, Decision Desk HQ, RealClearPolitics, Split Ticket, FiftyPlusOne, The Economist, Fox News, and Silver Bulletin. |
| Markets | Polymarket and Kalshi. A book under $10,000 is ignored. A primary market is ignored. |
| Endorsements | Trump and Teamsters endorsements matched to a candidate on the general-election ballot. |
| Demographics | 2012–2016 American Community Survey five-year estimates for college and nonwhite, and the 2010 Census for rural, from the 2018 county election-context file. Senate and governor only. Alaska is missing. |
| Maps | Current House lines. A split county is weighted by the votes cast in each piece. Where a precinct file exists, it is the 2024 presidential vote inside that county or district piece. |
| Early vote | Used in the model and not printed as a count. State and county reports compiled by the University of Florida Election Lab, through October 29, 2026. Where the state prints race or age on the ballots, that mix is read and is not a second point. Ohio’s own early in-person file for October 6 and 7. For Texas, primary history against the same point in 2022, through day 9, still past the one-point cap on October 28. Justin Vos’s day-10 county posts are that same count and are not the statewide margin. TargetSmart is not used. An L2 party model is not used. VoteHub’s modeled electorate is not used. A House district is not given a statewide early-vote margin. |
How to read a number
The figure on a race is a forecast of the vote margin, as of November 1, 2026. It is the sum of the counties, or of the pieces of counties inside a district. The seat totals, the shares, the win probabilities, and the vote figures in a table are the same forecast written out. They are not a count of ballots cast, not a certified return, and not a call of the race. A poll average, a market price, and an early-vote file are inputs. None of them is the result. Projections may be inaccurate and are not guaranteed.
These are predictions, not official results. Every number on this site is a forecast. Margins, win probabilities, seat totals, shares, and the vote figures in a table are not ballots cast, not a certified return, and not a call of a race. Projections may be inaccurate and are not guaranteed.