Wisconsin
Governor
Open seat
Forecast as of November 1, 2026. Every share and vote figure on this page is that forecast, added up from the counties below. Not a poll average, not ballots cast, and not an official result.
Why this race matters
This is the 8th closest governor race in the forecast, 6.9 points, out of 36.
36 governor races are in the forecast (19 Democratic leads, 17 Republican leads). A governor's race does not decide control of Congress.
No incumbent is on the ballot.
No earlier forecast of this race is archived, so there is no previous projection, date, or reason to show.
History block in the model: D+1.5. That is the office blend, not one past election.
Last same-office result in the candidate file: 2022 D+3.4. A special on the 2026 ballot is not automatically that contest.
Polling block: D+5.3. The published result is still the county sum.
Counties
Projected vote by county. Tap a county to open its precincts.
Drawing the counties.
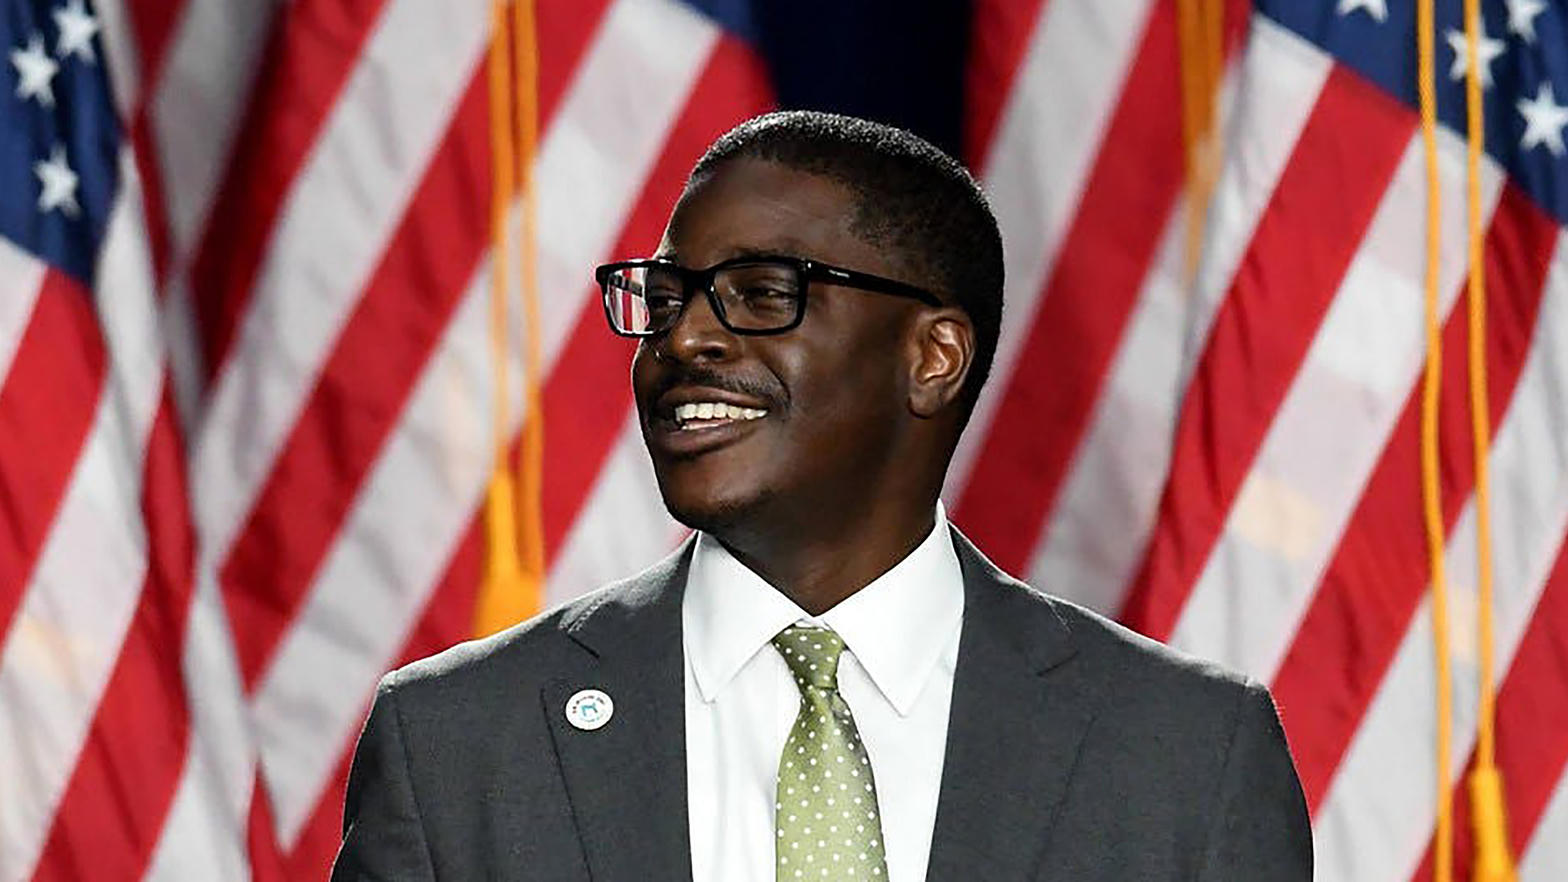 DDavid Crowley, D
David Crowley
Democratic
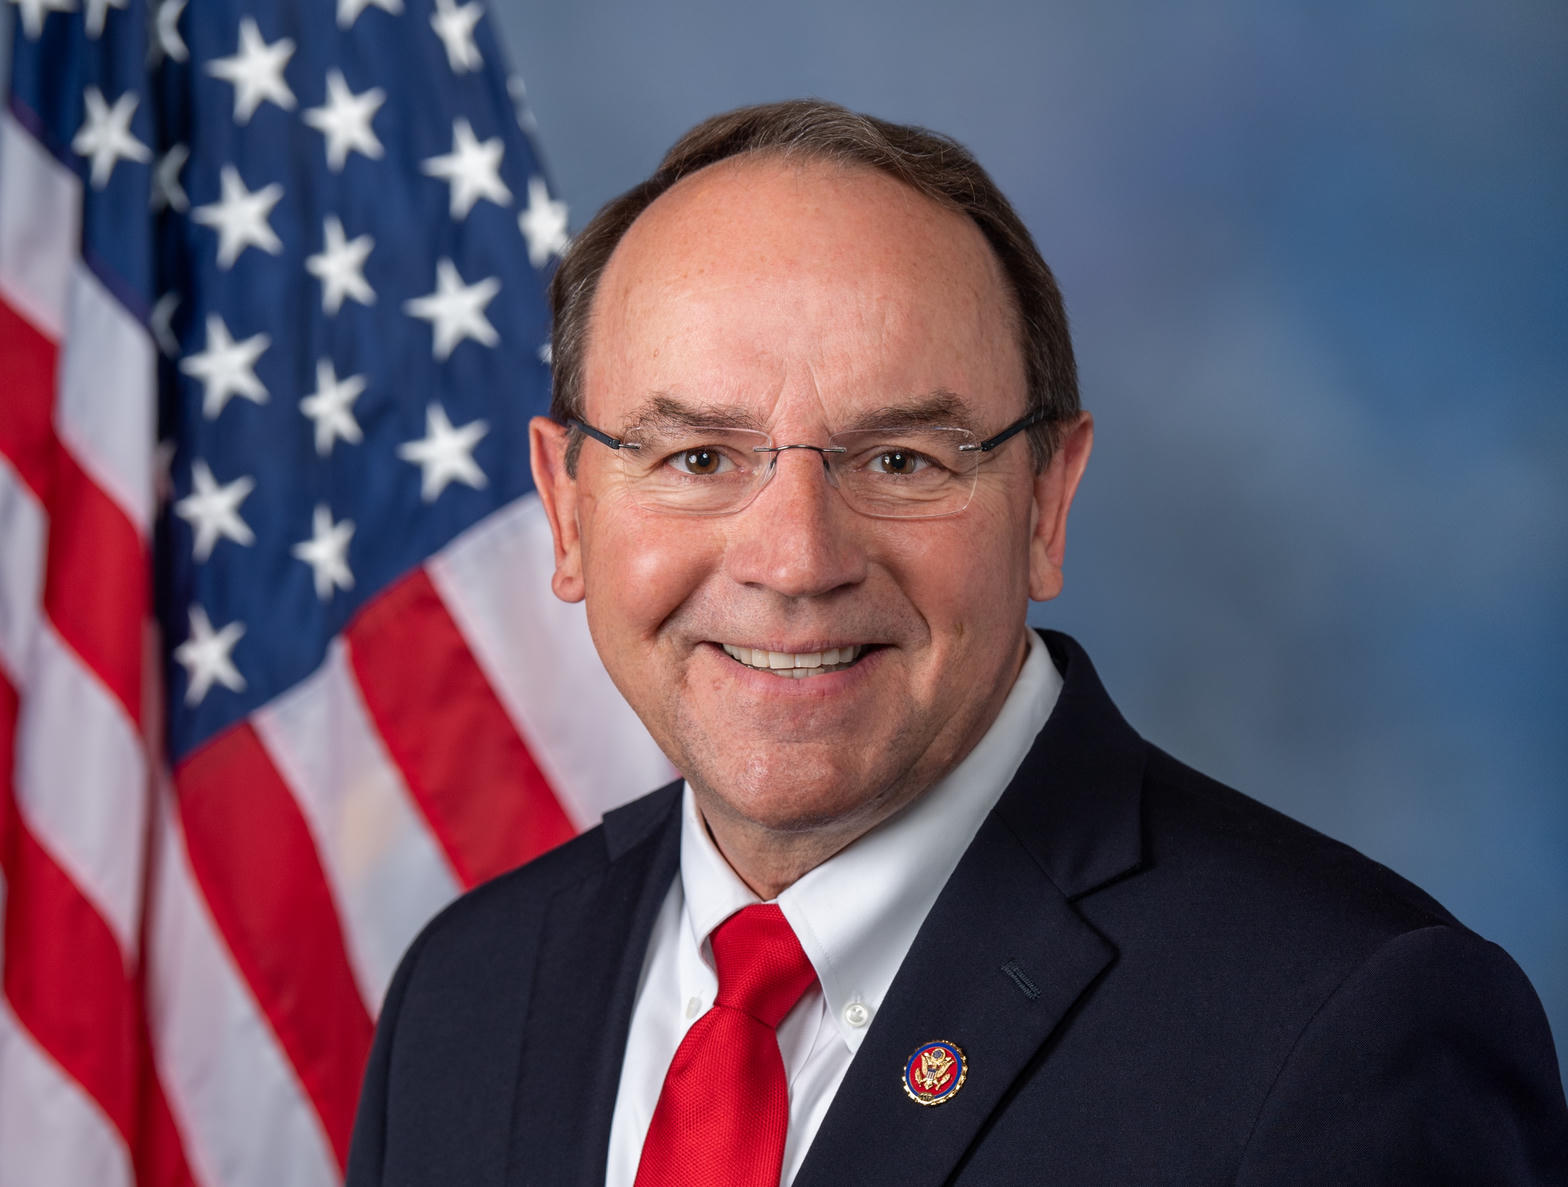 RTom Tiffany, R
Tom Tiffany
Republican
Other
Margin
D+6.9
Win probability
92.8%
80% interval
D+13.1 to D+0.9
95% interval
D+16.3 to R+2.4
Market
86%
David Crowley · win probability, not a vote shareRaw data Checking polls.
50,000 draws. The 80% interval is the 10th to the 90th percentile. The 95% interval is the 2.5th to the 97.5th. The thin mark is the 95% interval. The thick mark is the 80%. The hairline is zero. 2,673,308 projected votes, equal to the table. Not ballots cast.
Counties
Every reporting unit in the race. Tap a county to open its precincts. The projected votes above are this table added up. They are not ballots cast.
| Party | |||||
|---|---|---|---|---|---|
| Milwaukee County | DDavid Crowley, DDavid Crowley | D | D+44.2 | 71.4% | 374,800 |
| Dane County | DDavid Crowley, DDavid Crowley | D | D+58.7 | 78.6% | 295,489 |
| Waukesha County | RTom Tiffany, RTom Tiffany | R | R+18.0 | 58.3% | 222,601 |
| Brown County | RTom Tiffany, RTom Tiffany | R | R+1.6 | 50.1% | 120,645 |
| Outagamie County | RTom Tiffany, RTom Tiffany | R | R+4.2 | 51.4% | 90,633 |
| Racine County | RTom Tiffany, RTom Tiffany | R | R+0.3 | 49.4% | 86,987 |
| Winnebago County | DDavid Crowley, DDavid Crowley | D | D+1.9 | 50.2% | 77,076 |
| Washington County | RTom Tiffany, RTom Tiffany | R | R+33.8 | 66.2% | 73,834 |
| Kenosha County | DDavid Crowley, DDavid Crowley | D | D+3.0 | 50.8% | 73,275 |
| Rock County | DDavid Crowley, DDavid Crowley | D | D+18.1 | 58.3% | 71,363 |
| Marathon County | RTom Tiffany, RTom Tiffany | R | R+13.5 | 56.0% | 63,720 |
| La Crosse County | DDavid Crowley, DDavid Crowley | D | D+18.5 | 58.5% | 58,510 |
| Sheboygan County | RTom Tiffany, RTom Tiffany | R | R+11.8 | 55.2% | 54,596 |
| Ozaukee County | RTom Tiffany, RTom Tiffany | R | R+9.3 | 53.9% | 51,185 |
| Eau Claire County | DDavid Crowley, DDavid Crowley | D | D+18.1 | 58.3% | 51,027 |
| St. Croix County | RTom Tiffany, RTom Tiffany | R | R+11.3 | 54.9% | 48,982 |
| Walworth County | RTom Tiffany, RTom Tiffany | R | R+15.4 | 57.0% | 48,971 |
| Fond du Lac County | RTom Tiffany, RTom Tiffany | R | R+22.5 | 60.5% | 47,329 |
| Dodge County | RTom Tiffany, RTom Tiffany | R | R+25.6 | 62.1% | 40,733 |
| Jefferson County | RTom Tiffany, RTom Tiffany | R | R+9.4 | 54.0% | 40,524 |
| Manitowoc County | RTom Tiffany, RTom Tiffany | R | R+17.2 | 57.9% | 37,446 |
| Portage County | DDavid Crowley, DDavid Crowley | D | D+9.5 | 54.0% | 34,954 |
| Wood County | RTom Tiffany, RTom Tiffany | R | R+12.5 | 55.5% | 34,137 |
| Chippewa County | RTom Tiffany, RTom Tiffany | R | R+13.5 | 56.0% | 31,101 |
| Sauk County | DDavid Crowley, DDavid Crowley | D | D+9.0 | 53.8% | 30,431 |
| Columbia County | DDavid Crowley, DDavid Crowley | D | D+5.9 | 52.2% | 28,219 |
| Calumet County | RTom Tiffany, RTom Tiffany | R | R+15.2 | 56.9% | 26,614 |
| Waupaca County | RTom Tiffany, RTom Tiffany | R | R+25.3 | 61.9% | 24,595 |
| Polk County | RTom Tiffany, RTom Tiffany | R | R+20.9 | 59.7% | 22,850 |
| Grant County | RTom Tiffany, RTom Tiffany | R | R+5.0 | 51.8% | 22,073 |
| Barron County | RTom Tiffany, RTom Tiffany | R | R+19.1 | 58.8% | 21,685 |
| Dunn County | RTom Tiffany, RTom Tiffany | R | R+5.5 | 52.0% | 20,793 |
| Pierce County | RTom Tiffany, RTom Tiffany | R | R+6.3 | 52.4% | 20,507 |
| Douglas County | DDavid Crowley, DDavid Crowley | D | D+17.0 | 57.8% | 20,381 |
| Oconto County | RTom Tiffany, RTom Tiffany | R | R+33.7 | 66.1% | 20,152 |
| Oneida County | RTom Tiffany, RTom Tiffany | R | R+8.7 | 53.6% | 16,093 |
| Marinette County | RTom Tiffany, RTom Tiffany | R | R+25.2 | 61.9% | 14,306 |
| Green County | DDavid Crowley, DDavid Crowley | D | D+13.8 | 56.2% | 14,272 |
| Shawano County | RTom Tiffany, RTom Tiffany | R | R+25.4 | 62.0% | 13,773 |
| Monroe County | RTom Tiffany, RTom Tiffany | R | R+13.7 | 56.1% | 13,694 |
| Door County | DDavid Crowley, DDavid Crowley | D | D+9.4 | 54.0% | 13,539 |
| Vernon County | DDavid Crowley, DDavid Crowley | D | D+4.8 | 51.7% | 10,742 |
| Trempealeau County | RTom Tiffany, RTom Tiffany | R | R+8.5 | 53.5% | 10,409 |
| Lincoln County | RTom Tiffany, RTom Tiffany | R | R+14.9 | 56.7% | 10,093 |
| Iowa County | DDavid Crowley, DDavid Crowley | D | D+21.6 | 60.1% | 9,490 |
| Vilas County | RTom Tiffany, RTom Tiffany | R | R+16.0 | 57.3% | 9,455 |
| Clark County | RTom Tiffany, RTom Tiffany | R | R+26.5 | 62.5% | 8,993 |
| Juneau County | RTom Tiffany, RTom Tiffany | R | R+16.6 | 57.5% | 8,530 |
| Waushara County | RTom Tiffany, RTom Tiffany | R | R+24.1 | 61.3% | 8,432 |
| Adams County | RTom Tiffany, RTom Tiffany | R | R+13.9 | 56.2% | 7,547 |
| Kewaunee County | RTom Tiffany, RTom Tiffany | R | R+20.8 | 59.7% | 7,320 |
| Bayfield County | DDavid Crowley, DDavid Crowley | D | D+22.2 | 60.4% | 7,260 |
| Sawyer County | RTom Tiffany, RTom Tiffany | R | R+6.7 | 52.6% | 7,206 |
| Langlade County | RTom Tiffany, RTom Tiffany | R | R+24.8 | 61.7% | 6,846 |
| Jackson County | RTom Tiffany, RTom Tiffany | R | R+6.0 | 52.3% | 6,804 |
| Taylor County | RTom Tiffany, RTom Tiffany | R | R+37.7 | 68.1% | 6,560 |
| Green Lake County | RTom Tiffany, RTom Tiffany | R | R+27.0 | 62.8% | 6,478 |
| Washburn County | RTom Tiffany, RTom Tiffany | R | R+15.7 | 57.1% | 6,432 |
| Burnett County | RTom Tiffany, RTom Tiffany | R | R+19.5 | 59.0% | 6,346 |
| Richland County | DDavid Crowley, DDavid Crowley | D | D+1.7 | 50.1% | 6,029 |
| Crawford County | DDavid Crowley, DDavid Crowley | D | D+1.8 | 50.2% | 5,886 |
| Ashland County | DDavid Crowley, DDavid Crowley | D | D+20.0 | 59.3% | 5,788 |
| Lafayette County | RTom Tiffany, RTom Tiffany | R | R+4.7 | 51.6% | 5,722 |
| Marquette County | RTom Tiffany, RTom Tiffany | R | R+16.8 | 57.7% | 5,523 |
| Price County | RTom Tiffany, RTom Tiffany | R | R+18.4 | 58.5% | 5,200 |
| Rusk County | RTom Tiffany, RTom Tiffany | R | R+24.4 | 61.5% | 4,850 |
| Buffalo County | RTom Tiffany, RTom Tiffany | R | R+16.8 | 57.7% | 4,751 |
| Forest County | RTom Tiffany, RTom Tiffany | R | R+21.2 | 59.9% | 2,992 |
| Pepin County | RTom Tiffany, RTom Tiffany | R | R+15.6 | 57.1% | 2,556 |
| Iron County | RTom Tiffany, RTom Tiffany | R | R+15.1 | 56.8% | 2,395 |
| Florence County | RTom Tiffany, RTom Tiffany | R | R+38.0 | 68.2% | 1,855 |
| Menominee County | DDavid Crowley, DDavid Crowley | D | D+67.8 | 83.2% | 923 |
Model
- Raw data
2024 presidential baseline
National R−D 1.5County presidential file. Not the 2026 result.
- Raw data
Generic ballot
D 51.7 R 43.1 R−D -8.6National Wikipedia aggregate, 2026-10-30. State generic ballots, where a public poll exists, are mixed with the national swing for a race that does not have its own poll: ME, MI, NH, NY, OH. A state with no generic-ballot poll keeps the national swing and is not assigned a neighbor's.
- Raw data
Party identification
Pew D+5 and Gallup D+10, blend R−D -7.3Pew NPORS 2026, identifiers plus leaners: Republican 43, Democratic 48. Gallup party identification plus leaners, first two quarters of 2026: Democratic 49, Republican 39. Pew is 55% of this blend and Gallup is 45%.
- Model input
National block
R−D -8.160% generic ballot and 40% party identification. The swing versus the 2024 presidential margin is what gets transmitted.
- Model input
Swing transmitted
0.40 × -9.5 = -3.8This race has its own poll. The swing in the history blocks, before they shrink toward that poll, is the national block minus the 2024 presidential margin. Elasticity is shrunk halfway toward 1.
- Model input
History block
R−D -1.4Weights 2018 5 / 2024 35 / 2020 20 / 2022 16. If that office was on the ballot in 2022, that year takes the 40 and 2018 takes the 5. Otherwise 2018 keeps the 40. A missing year is filled with the 2020 result for the same office. Another office is not used. The year lines are Milwaukee County, the largest county, not the state total: 2018 D+35.1 w5, 2022 open seat D+40.3 w16. No incumbent is on the ballot, so the 2022 result keeps 40 percent of its usual weight and 40 percent of its gap versus the 2024 presidential margin. The prior nominee's margin is not the open-seat baseline. The state number above is the vote-weighted sum. A 2024 county map is not copied forward unchanged.
- Model input
Electorate block
R−D -5.4History reweighted by usual midterm turnout, plus half of the transmitted swing. Rural and presidential-only counties still move farther when the result is spread back to counties. That spread is ballot size, not the demographic file. Published ballots are the 2018 midterm canvass for this office, split by these modeled shares. They are not the 2024 presidential vote. The 2026 early-vote count is not inside this margin.
- Model input
Turnout block
R−D -4.1Each county is weighted by its 2018 ballots divided by its 2024 presidential ballots. Small counties shrink halfway toward the state median. 2020 mail shares are not used.
- Model input
National environment
R−D -6.0History plus the full transmitted swing. With no poll of this race, that swing is the state generic ballot mixed with the national block, or the national block alone.
- Model input
State environment
R−D -4.6History plus 45 percent of the transmitted swing. This is a Senate and governor weight.
- Model input
State partisan lean
R−D 0.9The 2024 presidential margin of this state, or of this district for a House race. It is heavier than the old state-environment block and is not shrunk toward the polling term.
- Model input
Trump popularity
R−D -8.9New York Times approval average, October 29, 2026: 37.4% approve, 60.2% disapprove. Net approval -22.800000000000004. That is not a vote share. Four-tenths of the net is a margin, then scaled by this place's partisan lean (factor 0.97), so an unpopular president costs more in a Democratic state.
- Model input
Candidate favorability
R−D 0.0Open seat or no incumbent. Favorability is zero.
- Model input
Demographics
R−D -6.6One statewide block only. A county that is more college-educated or more nonwhite than the other counties in this race takes more of the transmitted swing, and a more rural county takes less. That changes this block, at its weight. It does not choose which counties move when the margin is spread back out. That spread uses ballot size. The shares are the 2012–2016 American Community Survey and the 2010 Census, from the 2018 county election-context file. Alaska is not in that file.
- Model input
Finance
R−D -3.5No sourced spending edge. The block is history, or history shrunk toward the poll. It is not a finance model.
- Model input
Issues
R−D -3.5No sourced issue score. Same treatment as finance. It is not a separate issue model.
- Model input
Polling
R−D -7.4Individual polls -6 (80%) and the Wikipedia average -4.6 (20%). Named support R−D -5.7. Allocated support R−D -5.7. Named support does not move. Only the undecided line is split, 50.2% Republican and 49.8% Democratic. That is the 2024 two-party Republican share 50.4 moved halfway to 50 and capped at 60/40. A minor-party line is not published as its own candidate. Banned individual rows excluded: 0. One same-office miss, 2022: the poll was R−D 0.8 and the result was -3.4, miss -4.2. A single cycle is noisy, so 40 percent is kept. It is added to the polling term only. It is not a separate weight. Applied to the polling term: -1.68. Public pollsters: 2. Outliers: 0. Recency half-life 16 days. Sample weight n/(n+350). A registered-voter poll is 0.90. An internal poll, or a poll sponsored by one party, is weighted 0. It is not in the average. An internal-only file is dropped. A poll that names both parties is not an internal. A poll more than 8 points from the median of the others is cut in half. Pollster quality nudges that weight by only a few percent. The same rule is used on a House poll. House district polls are likely-voter polls only.
- Model input
Generic ballot weight
R−D -5.5The generic ballot stays in the blend next to the independent polls. It is not shrunk toward the poll and an internal does not replace it. Weight 9.5%.
- Model input
Top line
Not a House termSenate and governor are the top line. They are not moved by themselves.
- Model input
Candidate
R+0.00 added wholeOpen seat. No incumbency term. A negative popularity score is not added on top of the office baseline. No overperformance. An open seat, a scandal, or a missing incumbent gets none. These points are not watered down to the candidate weight. The candidate weight is a separate slice of the baseline. On a Senate or governor race with three public polls and no outlier, the points stop at that poll instead of moving past it.
- Model input
Scandal
NoneNo candidate on this ballot is scandal-defined.
- Model input
Endorsements
R−D +0.01Trump endorsed Tom Tiffany. The presidential lean here is R−D 0.9, so the endorsement helps 0.01. Ballotpedia, Endorsements by Donald Trump, 2026 tables, page updated August 5, 2026. A primary endorsement is counted when that person is the nominee. A lost primary, a candidate not on the ballot, and a withdrawn endorsement are not.
- Model input
Halfway floor
Not appliedNot applied. The state's 2024 presidential margin was inside 10 points, or there is no polling term.
- Model input
Pooling
35% of the way from each history block toward the polling termOtherwise the shrink is 35%.
- Model input
Prediction market
86% win probabilityDavid Crowley 85.5% is a win probability, not a vote share. Republican win probability 14.5 from Polymarket 14.5% Republican. A price of 50 is a tie. Each point above 50 is 0.35 margin points, capped at 12, so the raw margin is -12.0. That margin is shrunk 40% toward the pre-market margin -4.5, which leaves -9.0. It enters once, at 5.0%. The polling term is not nudged. Books under $10,000 and primary markets are ignored.
- Model input
State bend
R−D -2.4WI is adjusted 2.4 points toward the Democrats after the blend, from -4.7 to -7.1. Florida takes less of a Democratic national swing. Iowa, Wisconsin, and Arizona are not left pinned to a red presidential lean when the race is close. A seat already 15 points the other way, or a House seat whose own lines are 6 points that way and the race is already 4 points that way, only moves 1.2.
- Model input
State environment adjustment
National onlyThis state already has its own environment adjustment after the blend. It is not given a second one.
- Model input
Early vote
D+0.6No party is on the file. Ballots that match a 2024 presidential county sit at R−D -3.4. The 2024 vote in the same counties was R−D 0.9. The early mix is D+4.3 relative to that vote. Fifteen percent is kept, capped at 1, so D+0.6. This is where the ballots were cast. A more college-educated or more nonwhite county still takes more of the national swing in the demographics block, and a more rural county takes less. That block is separate from this point. This is not a count of how anyone voted, and not another model's estimate of the electorate.
- Model input
Other ratings
R−D -1.5 at 3.0%Cook, Sabato, Inside Elections, and the other columns on the same published tables (Decision Desk HQ, RealClearPolitics, Split Ticket, FiftyPlusOne, The Economist, Fox News, Silver Bulletin). 7 ratings, average R−D -1.5. A toss-up is 0, tilt 1.5, lean 3.5, likely 7, safe or solid 12. If this race is already further to that side, the rating does not pull it back. Mixed in after everything else, at 3.0 percent. It does not replace the poll. A seat nobody has rated is left alone.
- Model input
Weights
polling 20.7% · generic 8.8% · stateLean 12.5% · trump 9.4% · favorability 8.7% · history 6.4% · candidate 6.3% · electorate 3.9% · stateEnv 3.9% · national 3.9% · turnout 2.3% · demographics 2.3% · finance 1.6% · issues 1.7% · market 4.9% · ratings 3.0%History is lighter. State partisan lean, Trump popularity, and candidate favorability are their own terms. A market, when it qualifies, scales every other weight and is not taken out of polling alone. Published ratings, when a race has them, are mixed in after that. They are not taken out of polling alone.
County-sum margin
-6.9This is the sum of the county projections. Counties are not moved afterward to force this total.
Minor parties
NoneOther is the 2024 presidential vote that was neither Democratic nor Republican, weighted by these counties. It is not the last forecast. A missing opponent is not Other. No Libertarian, Green, Constitution, or other minor line was on this ballot.
80% interval
-13.1 to -0.910th to 90th percentile of 50,000 draws. Poll, national, state, turnout, and candidate error.
95% interval
-16.3 to 2.42.5th to 97.5th percentile. Senate and governor state errors in the same state share a correlation of 0.30. The band shown is the marginal interval.
Wikipedia, 2026 United States gubernatorial elections (general-election infobox) www.tmj4.com/news/state-capitol/tony-evers-will-not-seek-a-third-term-as-governor-of-wisconsin