Maine
Governor
Open seat
Forecast as of October 7, 2026. These vote totals equal the sum of the counties below. Not a poll average.
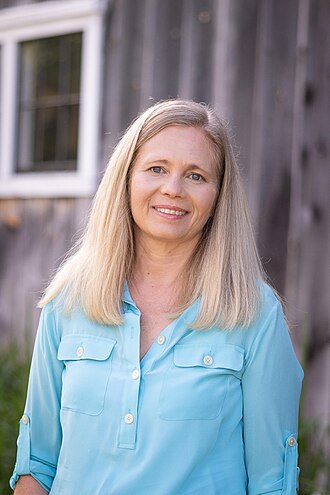 DHannah Pingree, D
Hannah Pingree
Democratic
 RRobert B. Charles, R
Robert B. Charles
Republican
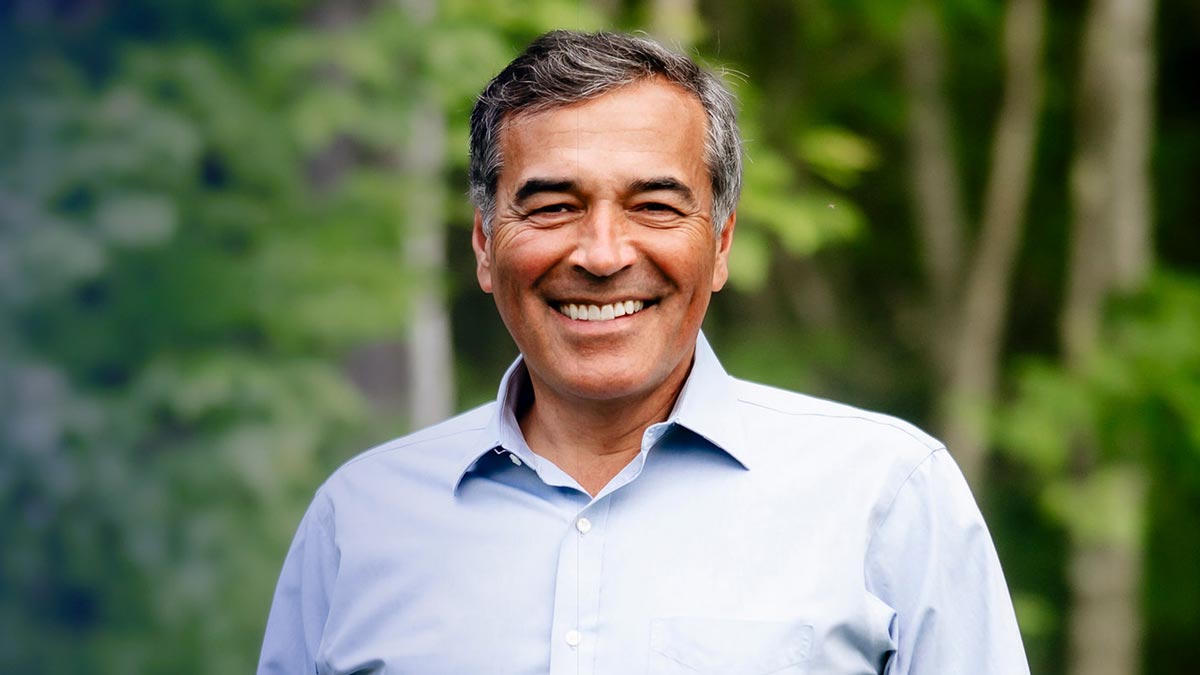 IRick Bennett, I
Rick Bennett
Independent
Other
Margin
D+10.7
Win probability
98.8%
80% interval
D+16.8 to D+4.6
95% interval
D+20.1 to D+1.4
Market
95%
Hannah Pingree · win probability, not a vote shareRaw data Checking polls.
50,000 draws. The 80% interval is the 10th to the 90th percentile. The 95% interval is the 2.5th to the 97.5th. The thin mark is the 95% interval. The thick mark is the 80%. The hairline is zero. 630,667 ballots, equal to the table.
Counties
Every reporting unit in the race. Sort any column. The votes above are this table added up.
| Party | |||||
|---|---|---|---|---|---|
| Cumberland County | DHannah Pingree, DHannah Pingree | D | D+36.9 | 66.6% | 160,095 |
| York County | DHannah Pingree, DHannah Pingree | D | D+12.6 | 54.4% | 106,747 |
| Penobscot County | RRobert B. Charles, RRobert B. Charles | R | R+6.3 | 51.2% | 69,970 |
| Kennebec County | DHannah Pingree, DHannah Pingree | D | D+1.3 | 48.8% | 58,570 |
| Androscoggin County | RRobert B. Charles, RRobert B. Charles | R | R+2.8 | 49.5% | 47,289 |
| Hancock County | DHannah Pingree, DHannah Pingree | D | D+15.2 | 55.7% | 29,131 |
| Aroostook County | RRobert B. Charles, RRobert B. Charles | R | R+20.6 | 58.4% | 28,650 |
| Oxford County | RRobert B. Charles, RRobert B. Charles | R | R+8.1 | 52.1% | 22,237 |
| Somerset County | RRobert B. Charles, RRobert B. Charles | R | R+20.0 | 58.1% | 16,570 |
| Waldo County | DHannah Pingree, DHannah Pingree | D | D+8.0 | 52.1% | 16,155 |
| Sagadahoc County | DHannah Pingree, DHannah Pingree | D | D+19.2 | 57.7% | 15,722 |
| Lincoln County | DHannah Pingree, DHannah Pingree | D | D+13.7 | 55.0% | 15,431 |
| Knox County | DHannah Pingree, DHannah Pingree | D | D+22.3 | 59.2% | 15,085 |
| Washington County | RRobert B. Charles, RRobert B. Charles | R | R+15.9 | 56.0% | 11,603 |
| Franklin County | RRobert B. Charles, RRobert B. Charles | R | R+1.4 | 48.8% | 11,466 |
| Piscataquis County | RRobert B. Charles, RRobert B. Charles | R | R+22.6 | 59.4% | 5,946 |
Model
- Raw data
2024 presidential baseline
National R−D 1.5County presidential file. Not the 2026 result.
- Raw data
Generic ballot
D 50.8 R 42.6 R−D -8.2National Wikipedia aggregate, October 5, 2026. State generic ballots, where a public poll exists, replace a uniform national swing: ME, MI, NH, NY, OH. A state with no generic-ballot poll keeps the national number and is not assigned a neighbor's.
- Raw data
Party identification
Pew D+5 and Gallup D+10, blend R−D -7.3Pew NPORS 2026, identifiers plus leaners: Republican 43, Democratic 48. Gallup party identification plus leaners, first two quarters of 2026: Democratic 49, Republican 39. Pew is 55% of this blend and Gallup is 45%.
- Model input
National block
R−D -7.860% generic ballot and 40% party identification. The swing versus the 2024 presidential margin is what gets transmitted.
- Model input
Swing transmitted
0.40 × -9.3 = -3.7Only the share of the national swing this state took in the last midterm is transmitted. Elasticity is shrunk halfway toward 1.
- Raw data
2026 early vote
17,963 reported cast17,963 ballots reported cast as of 10/6/2026: 17,963 mail returned and 0 in person. Day-1 early vote is a signal, not a statewide margin. Mail is a count of returns, not the 2024 mail share. Applications and ballots that were only sent are not in this count. A day-1 pace gap is not a statewide margin.
- Model input
History block
R−D -9.5Weights 2018 5 / 2024 35 / 2020 20 / 2022 16. 2020 and 2022 results for this office are included in every state that had those races, including blowouts. A 2022 election is weighted ahead of 2018. If that office was not on the ballot, the 2020 result for the same office fills the year. Another office is not used. 2018 R+4.7 w5, 2022 open seat R+3.6 w16. No incumbent is on the ballot, so the 2022 result keeps 40 percent of its usual weight and 40 percent of its gap versus the 2024 presidential margin. The prior nominee's margin is not the open-seat baseline. This is the last result for the office, not the presidential margin. A 2024 county map is not copied forward unchanged. A 2018 model error is not used.
- Model input
Electorate block
R−D -12.9History reweighted by usual midterm turnout, plus half of the transmitted swing. Rural and presidential-only counties still move farther when the result is spread back to counties. Published ballots are the 2018 midterm canvass for this office, split by these modeled shares. They are not the 2024 presidential vote. The 2026 early-vote count is not inside this margin.
- Model input
Turnout block
R−D -11.7Each county is weighted by its 2018 ballots divided by its 2024 presidential ballots. Small counties shrink halfway toward the state median. 2020 mail shares are not used. 17,963 ballots reported cast as of 10/6/2026: 17,963 mail returned and 0 in person. Day-1 early vote is a signal, not a statewide margin. Mail is a count of returns, not the 2024 mail share.
- Model input
National environment
R−D -14.0History plus the full transmitted swing from the 60/40 national block.
- Model input
State environment
R−D -12.6History plus 45% of the transmitted swing.
- Model input
State partisan lean
R−D -6.9The 2024 presidential margin of this state, or of this district for a House race. It is heavier than the old state-environment block and is not shrunk toward the polling term.
- Model input
Trump popularity
R−D -11.3New York Times approval average, October 7, 2026: 37% approve, 60% disapprove. Net approval -23. That is not a vote share. Four-tenths of the net is a margin, then scaled by this place's partisan lean (factor 1.23), so an unpopular president costs more in a Democratic state.
- Model input
Candidate favorability
R−D 0.0Open seat or no incumbent. Favorability is zero.
- Model input
Demographics
R−D -14.2County college, rural, and nonwhite shares from the 2018 election-context file change how much of the swing a county takes. No separate microdata file.
- Model input
Finance
R−D -11.5No sourced spending edge, so the block starts on history. With a poll, it shrinks toward the polling term with the other non-poll blocks.
- Model input
Issues
R−D -11.5No sourced issue score. Same treatment as finance.
- Model input
Polling
R−D -15.3Individual polls -11.6 (80%) and the Wikipedia average -11.3 (20%). Named support R−D -11.4. Allocated support R−D -11.5. Named support does not move. Only the undecided line is split, 48.2% Republican and 51.8% Democratic. That is the 2024 two-party Republican share 46.5 moved halfway to 50 and capped at 60/40. A named third-party vote stays third-party. Banned individual rows excluded: 0. State miss shrunk 40% toward zero: -3.72. Public pollsters: 11. Outliers: 1. Recency half-life 16 days. Sample weight n/(n+350). A registered-voter poll is 0.90. An internal poll, or a poll sponsored by one party, is weighted 0.20, and only when a public poll is also in the race. An internal-only file is dropped. A poll that names both parties is not an internal. A poll more than 8 points from the median of the others is cut in half.
- Model input
Candidate
R+0.00 reaches the resultOpen seat. No incumbency term. A negative popularity score is not added on top of the office baseline. No overperformance. An open seat, a scandal, or a missing incumbent gets none.
- Model input
Halfway floor
Not appliedNot applied. The state's 2024 presidential margin was inside 10 points, or there is no polling term.
- Model input
Pooling
35% of the way from each history block toward the polling termOtherwise the shrink is 35%.
- Model input
Prediction market
95% win probabilityHannah Pingree 94.9% is a win probability, not a vote share. Republican win probability 5.1 from Kalshi 5.2% Republican; Polymarket 5.0% Republican. A price of 50 is a tie. Each point above 50 is 0.35 margin points, capped at 12, so the raw margin is -12.0. That margin is shrunk 40% toward the pre-market margin -10.7, which leaves -11.5. It enters once, at 5.0%. The polling term is not nudged. Books under $10,000 and primary markets are ignored.
- Model input
State bend
NoneNot applied.
- Model input
Weights
polling 20.4% · history 7.5% · candidate 7.4% · electorate 4.7% · stateEnv 4.7% · national 4.7% · turnout 2.8% · demographics 2.8% · finance 1.9% · issues 1.9% · stateLean 14.9% · trump 11.2% · favorability 10.3% · market 5.0%History is lighter. State partisan lean, Trump popularity, and candidate favorability are their own terms. A market, when it qualifies, scales every other weight and is not taken out of polling alone.
County-sum margin
-10.7This is the sum of the reporting units after each unit moved off its own history. It is not the poll average.
80% interval
-16.8 to -4.610th to 90th percentile of 50,000 draws. Poll, national, state, turnout, and candidate error.
95% interval
-20.1 to -1.42.5th to 97.5th percentile. Senate and governor state errors in the same state share a correlation of 0.30. The band shown is the marginal interval.
Wikipedia, 2026 United States gubernatorial elections (general-election infobox) mainemorningstar.com/briefs/hannah-pingree-officially-launches-run-for-governor/